
Introduction
Variability is a fundamental concept in statistics that refers to how spread out or dispersed the values in a data set are. It’s a measure of the degree to which individual data points differ from the overall pattern or average. Variability helps us understand how consistent or inconsistent data is, which is crucial in making predictions, analyzing trends, and drawing conclusions.
What is Variability?
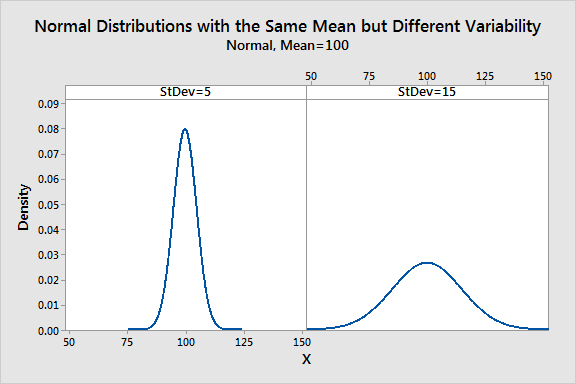
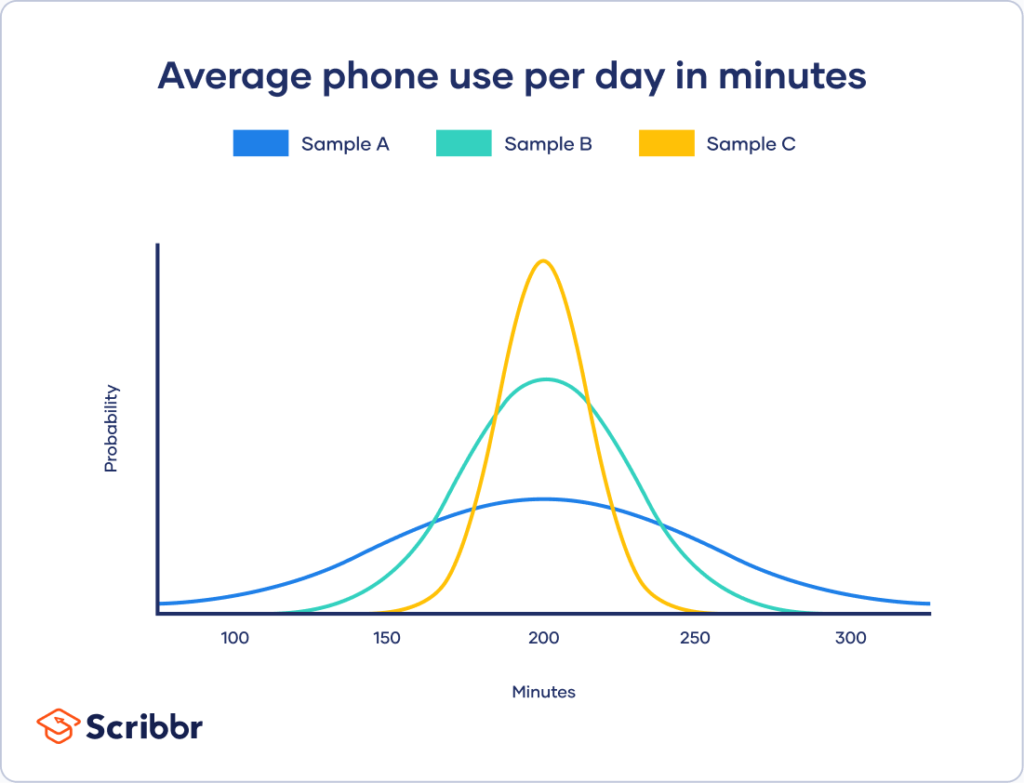
At its core, variability indicates how much variation exists in a set of data. If data points are close to each other and the mean, the variability is low. Conversely, if the data points are spread out over a wide range of values, the variability is high. Understanding variability is essential for interpreting data accurately.
Types of Variability
- Range: The difference between the highest and lowest values in a data set. It gives a quick sense of the spread of the data.
- Variance: Measures the average squared deviation from the mean. It provides a more comprehensive understanding of data dispersion.
- Standard Deviation: The square root of variance, standard deviation is one of the most commonly used measures of variability. It represents the average distance of each data point from the mean.
- Interquartile Range (IQR): The range between the first quartile (25th percentile) and the third quartile (75th percentile). IQR is useful for understanding the spread of the middle 50% of the data.
Importance of Variability
Understanding variability is crucial for several reasons:
- Decision Making: In business, variability can indicate the reliability of a process. For example, low variability in manufacturing processes can lead to consistent product quality.
- Risk Assessment: In finance, variability (often referred to as volatility) helps assess the risk of an investment. High variability in stock prices suggests higher risk.
- Quality Control: Variability is also essential in quality control. By monitoring variability, organizations can identify and rectify inconsistencies in their processes.
Variability in Everyday Life
Variability isn’t just a statistical concept; it plays a role in everyday decision-making. For instance:
- Weather: Weather forecasts often discuss variability, such as the range of temperatures expected in a day. Understanding this variability helps in planning activities.
- Health: Variability in health metrics, like blood pressure or cholesterol levels, can indicate the need for medical intervention or lifestyle changes.
- Education: In education, understanding variability in test scores can help teachers identify students who may need additional support or challenge.
Reducing Variability
In many cases, reducing variability is desirable. For example, in manufacturing, reducing variability can lead to more consistent product quality, which improves customer satisfaction and reduces costs.
- Standardization: Implementing standardized procedures and protocols can reduce variability.
- Quality Improvement Programs: Initiatives like Six Sigma focus on reducing variability in processes to improve overall quality.
- Training and Education: Ensuring that employees are well-trained and understand the importance of consistency can help reduce variability in performance.
Conclusion
Variability is a critical concept that affects various aspects of life, from business and finance to health and education. Understanding and managing variability allows us to make more informed decisions, reduce risks, and improve the quality of processes and outcomes. Whether you’re analyzing data or making everyday decisions, considering variability can lead to better results.
FAQs
- What is variability in statistics?
Variability refers to how spread out the data points are in a data set. It indicates the degree of difference among the values. - How is variability measured?
Variability can be measured using several metrics, including range, variance, standard deviation, and interquartile range (IQR). - Why is variability important?
Variability is important because it helps us understand the consistency and reliability of data, which is crucial for decision-making and risk assessment. - Can variability be reduced?
Yes, variability can be reduced through standardization, quality improvement programs, and proper training. - How does variability affect decision-making?
Variability affects decision-making by providing insights into the reliability and risk associated with different options or processes.